United States of America Flag
Looks like you’re in the United States.
For content and features tailored to the US, change to our US site.
New Zealand flag
Looks like you’re in
New Zealand.
For content and features tailored to New Zealand, change to our NZ site.
Australia Flag
Looks like you’re in Australia.
For content and features tailored to Australia, change to our AU site.
Globe icon
Looks like you’re outside our main regions.
Halter is growing fast. While we currently support New Zealand, Australia, and the US, you can still learn more about what we do worldwide.

Dairy Solutions

Harvest more pasture

Pasture is the cheapest and most resilient way to feed your herd. Improving pasture performance can both increase your production and lower your costs.
A farmer holds a smartphone displaying the Halter app with pasture data for Paddock E4, showing grazing metrics and a field map, with green grass in the background.

How Halter reduces the day-to-day workload

A black and white dairy cow wearing a Halter Collar grazes on green pasture at sunset.
Blades of grass icon

Flexible grazing

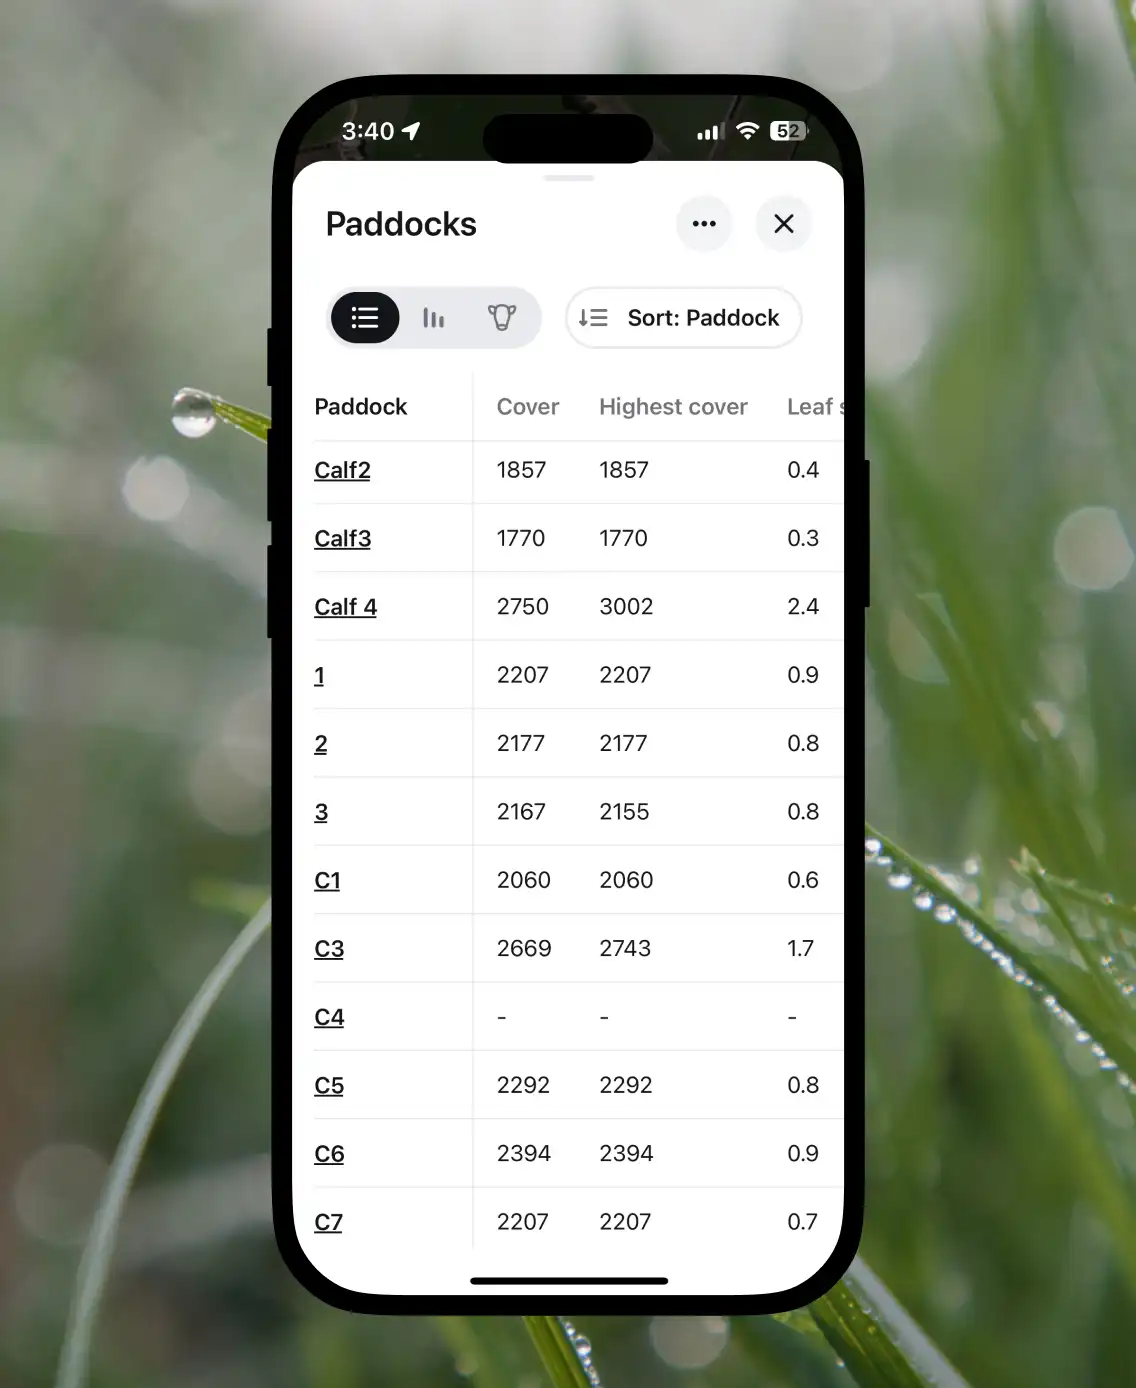
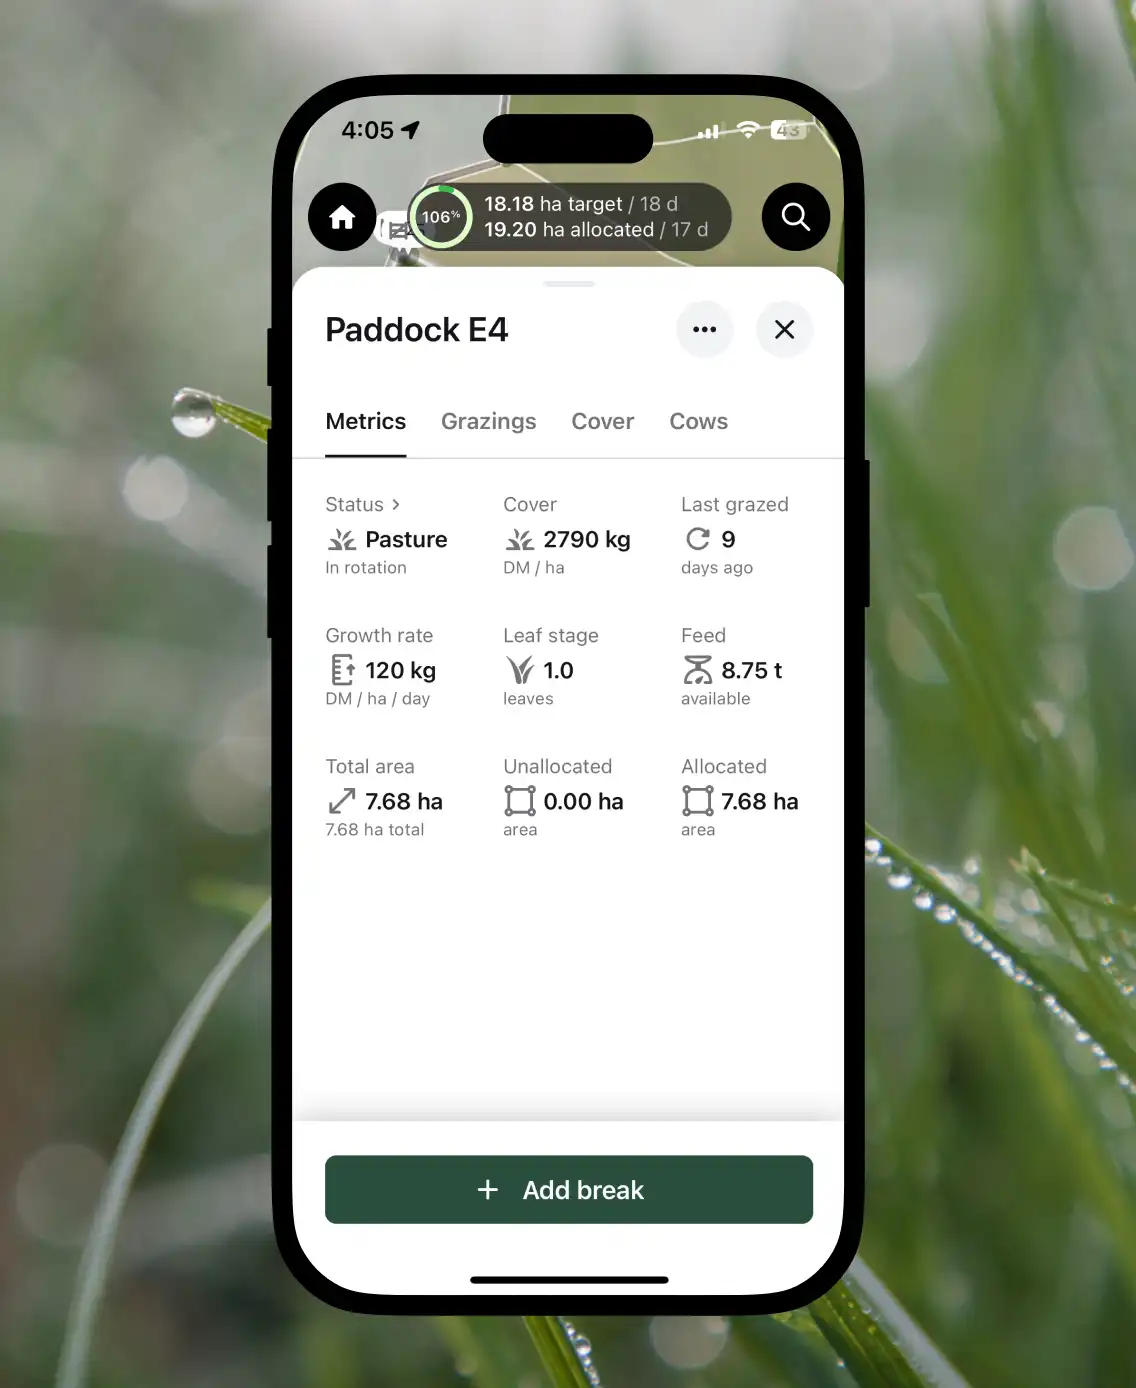
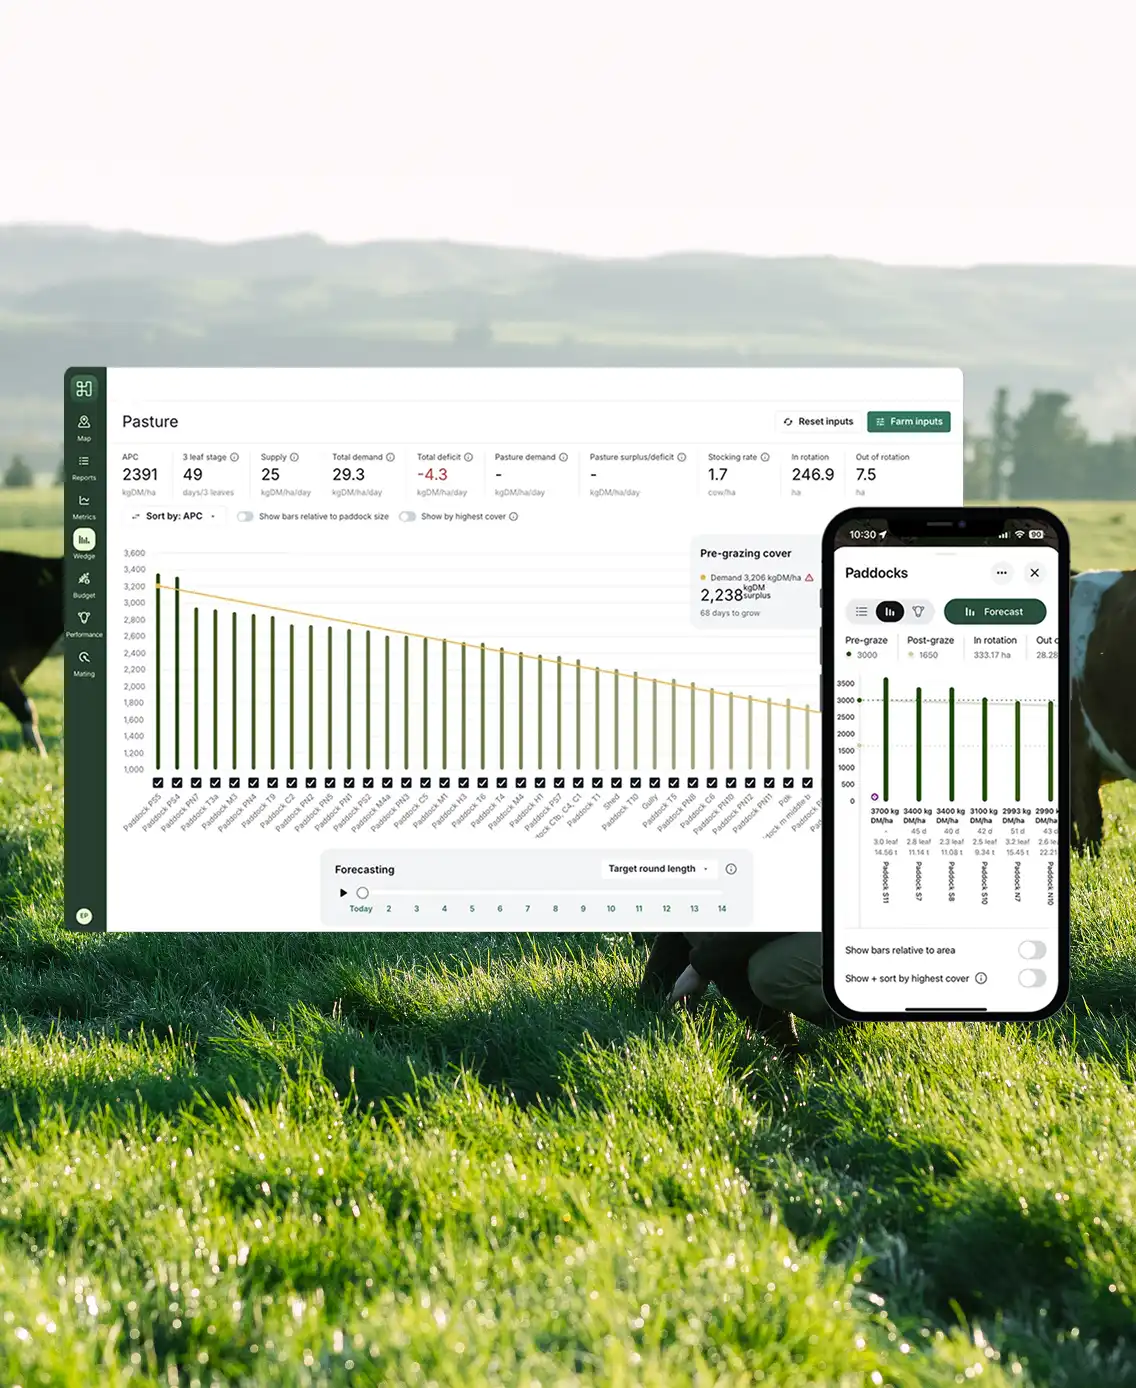
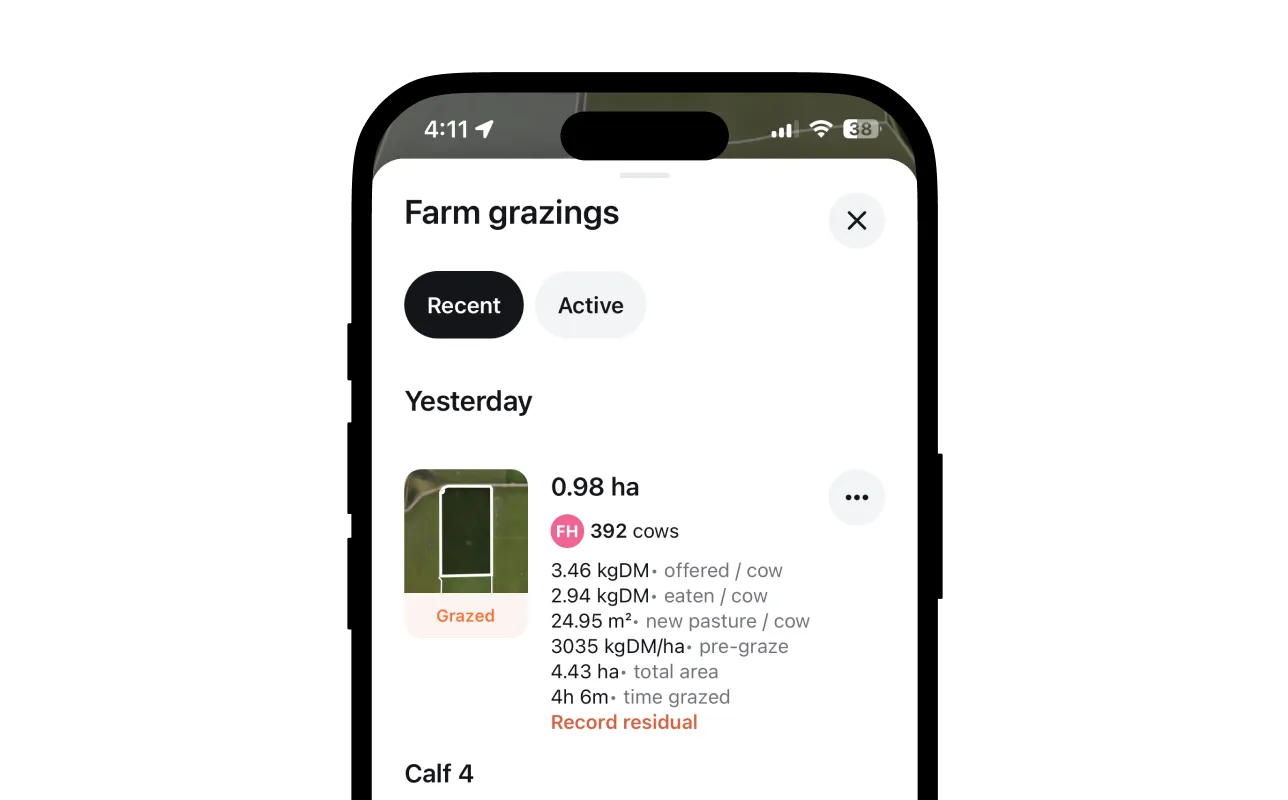
Graze at the right time, every time, for maximum regrowth

A farmer sits in a vehicle, looking out at a large herd of dairy cows.
two light green ticks icon

Achieve residuals consistently

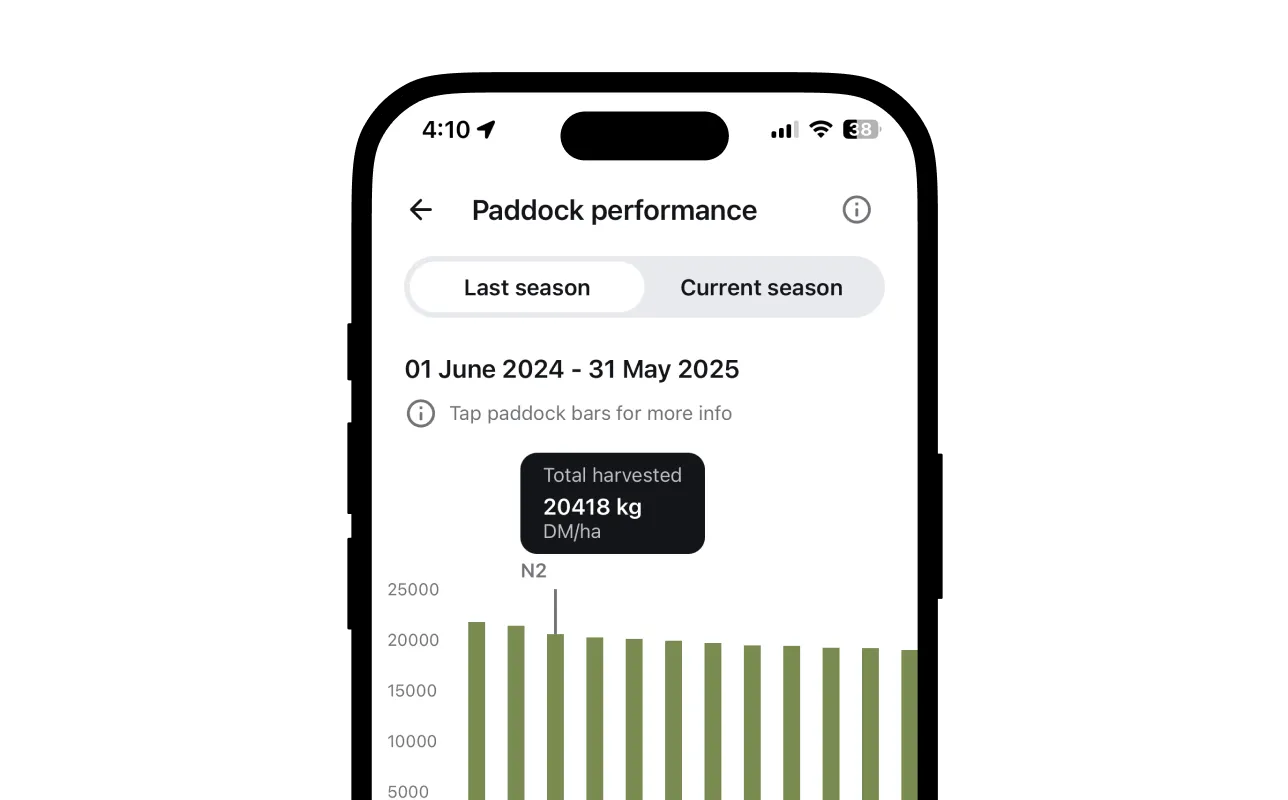
Hit residuals and allocations to harvest more grass per hectare

A farmer standing in a pasture uses a phone with cows grazing in the background.
Calendar icon

Confident planning

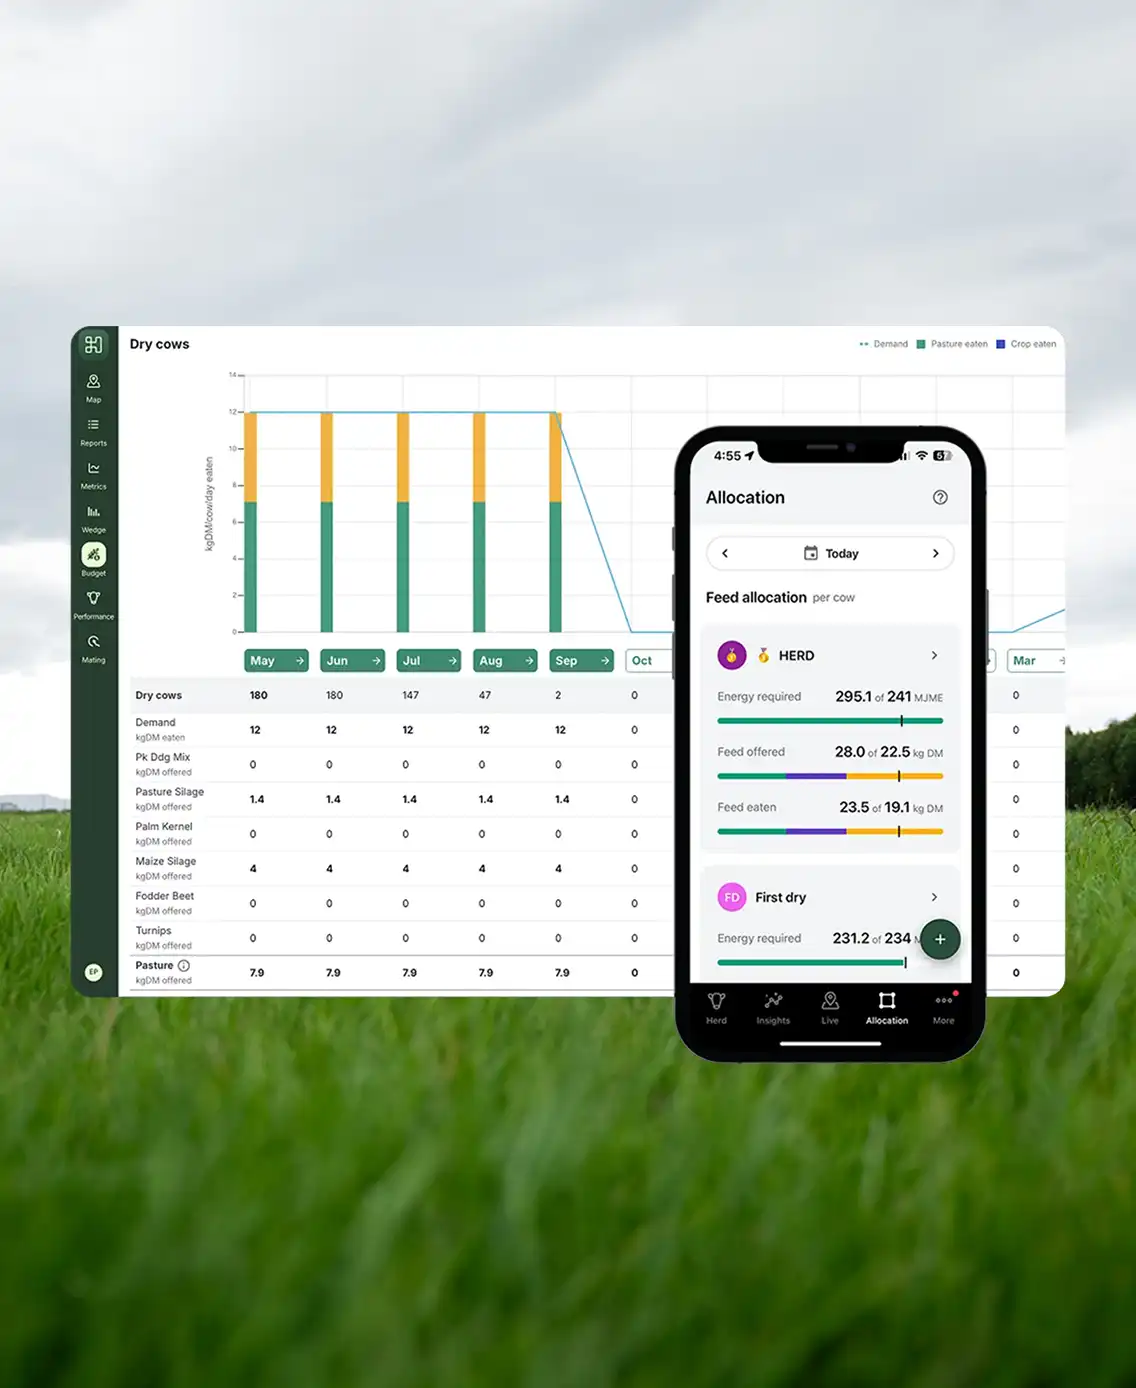
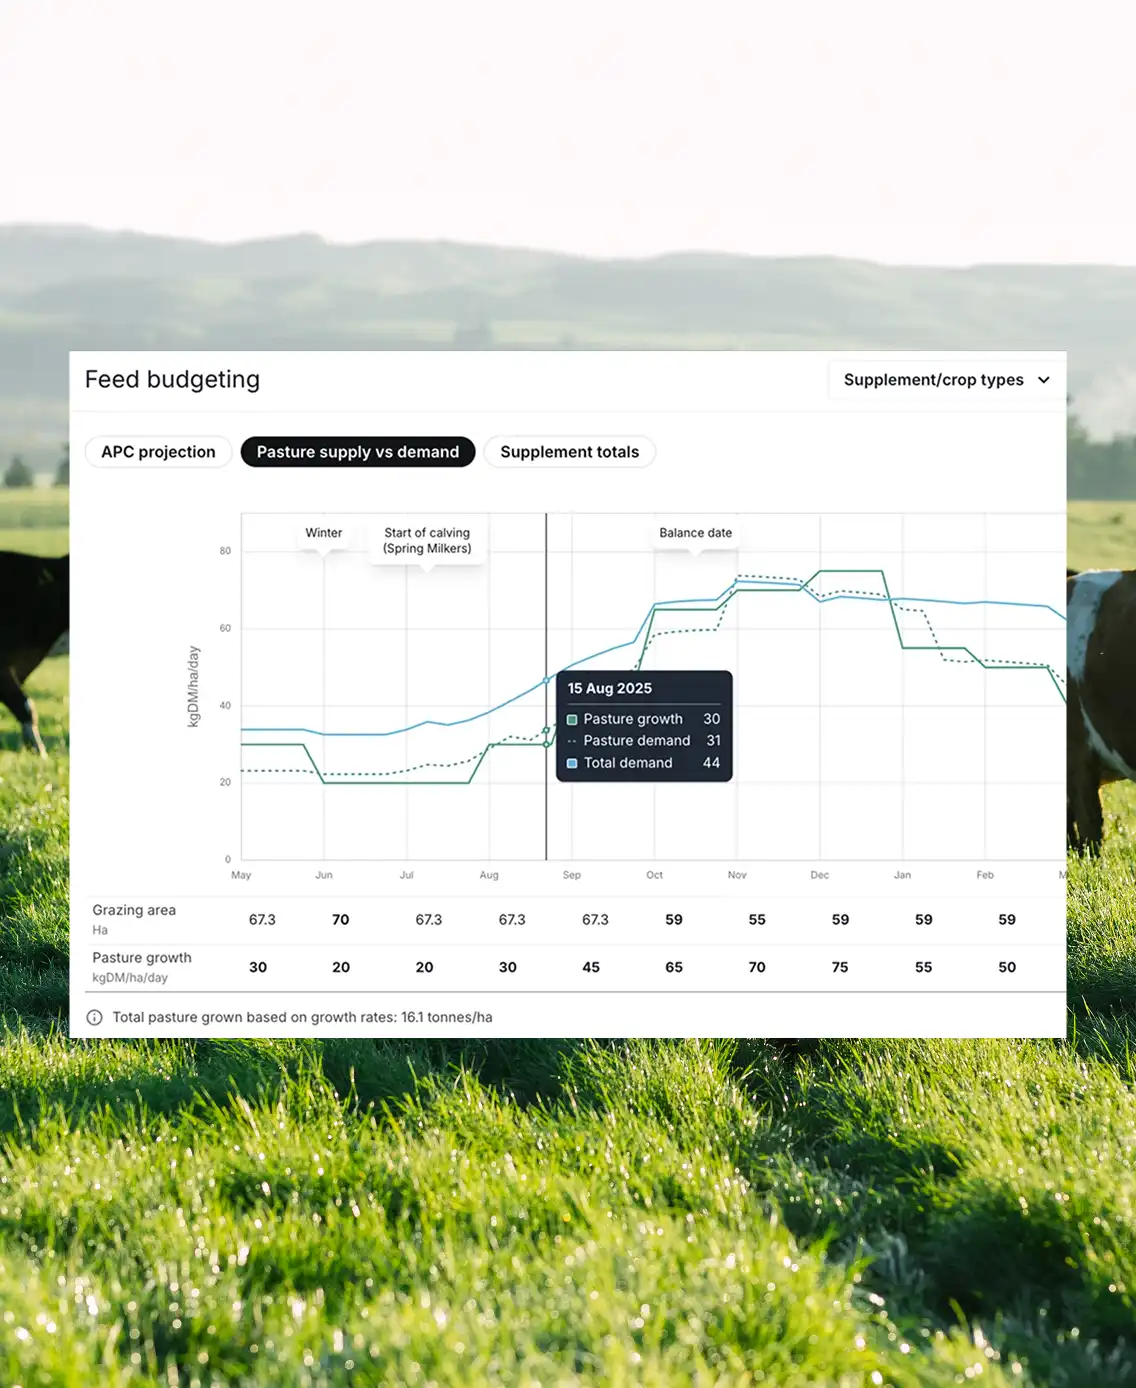
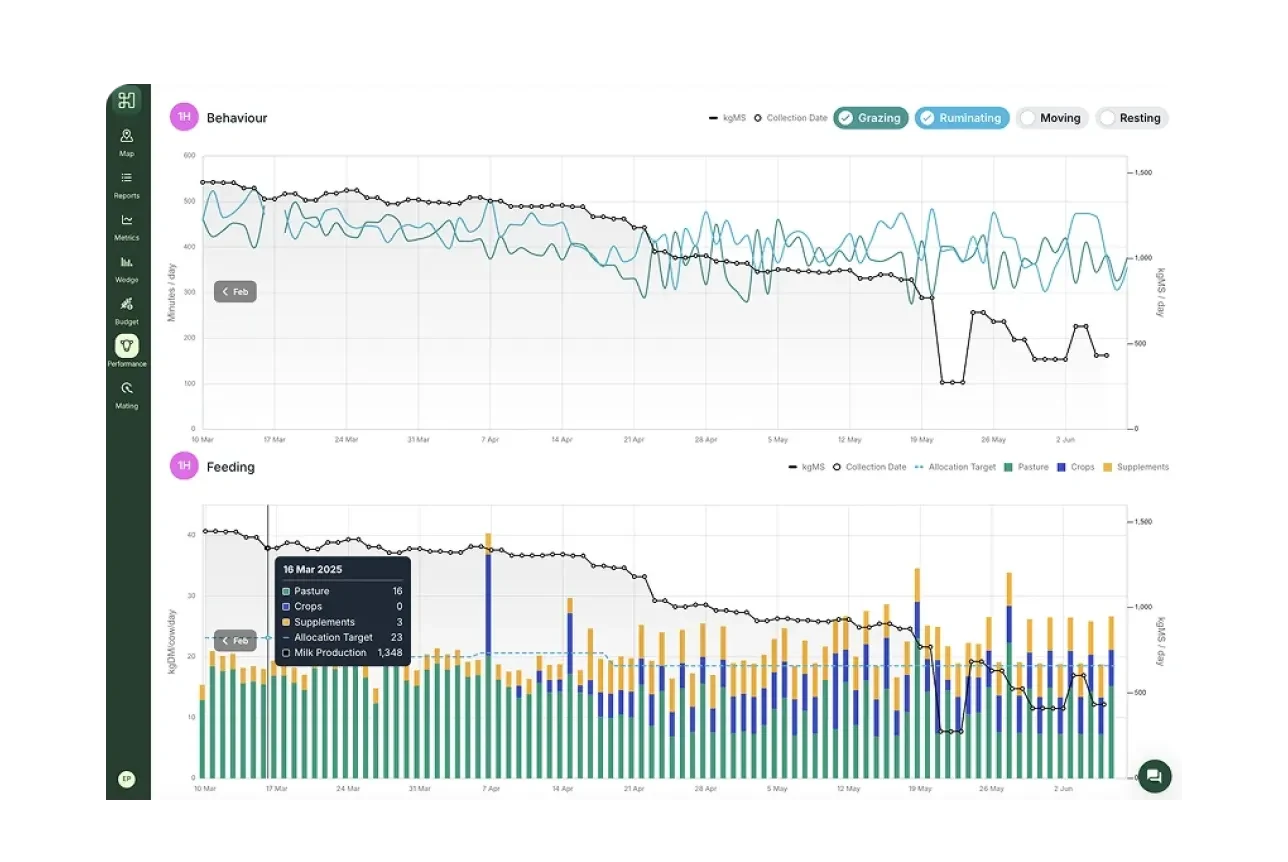
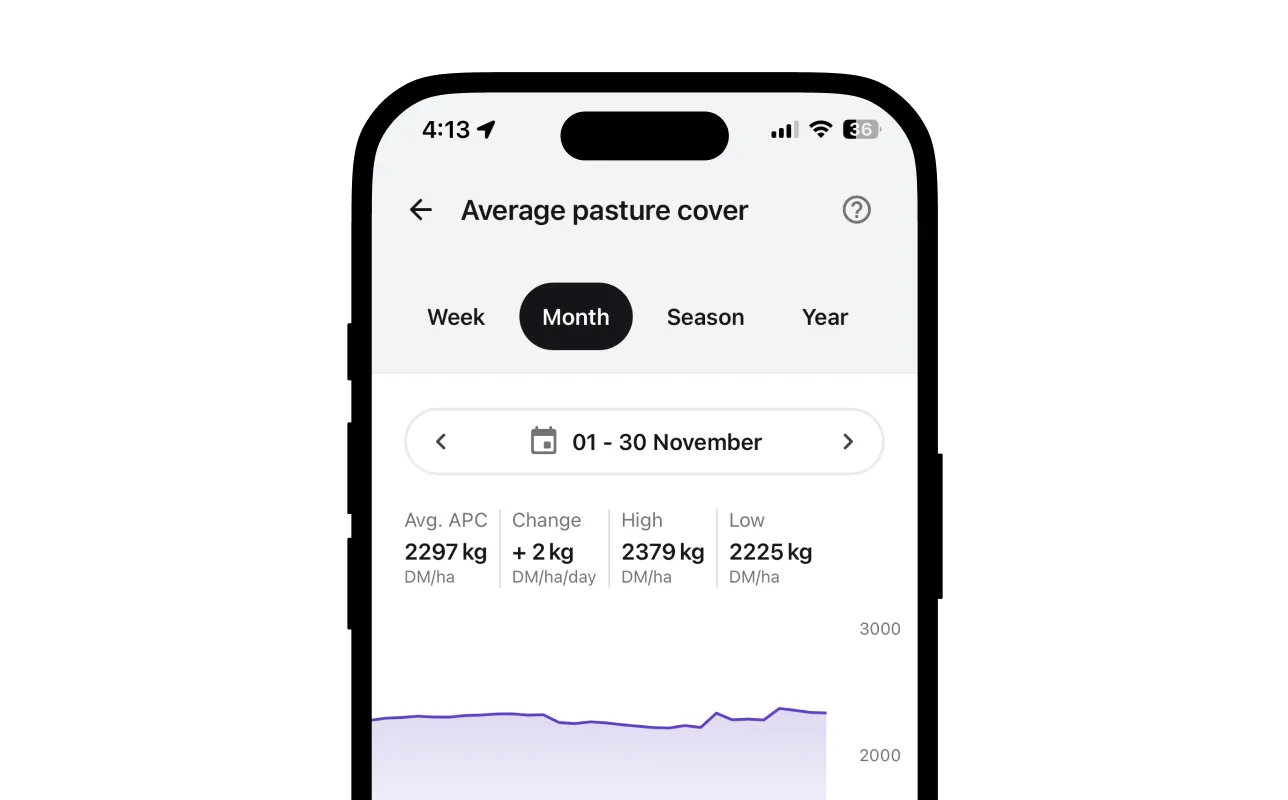
Ensure you’re carrying the right amount of pasture cover through the seasons

Integrations

Make operations & record-keeping easy

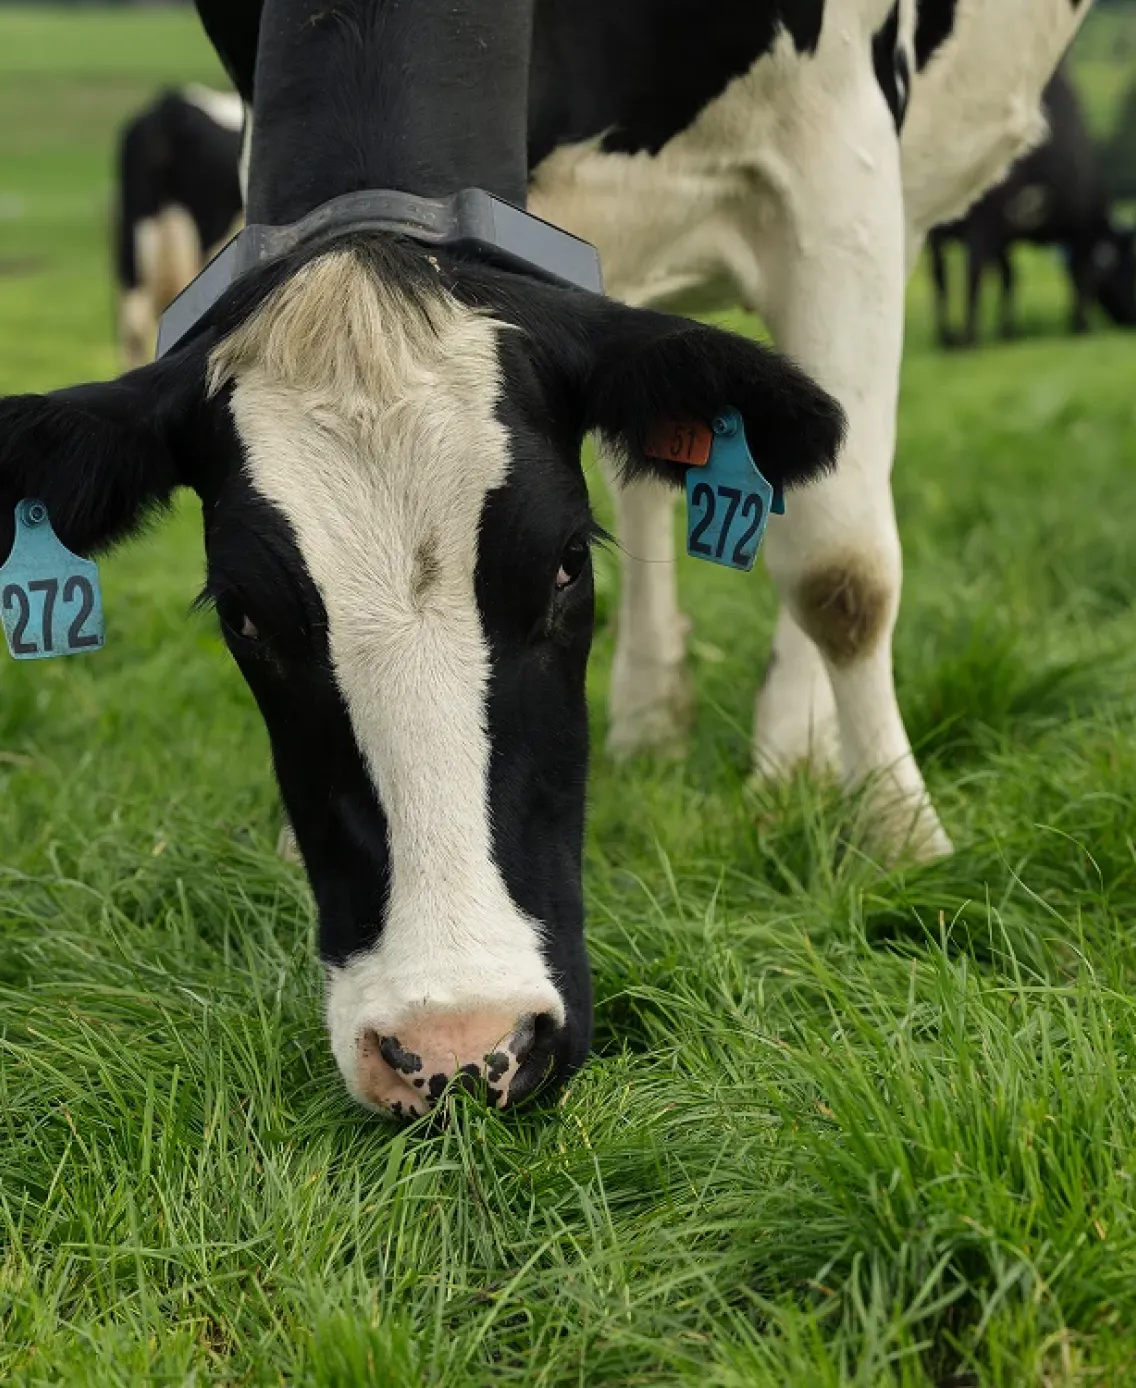
Halter integrates with drafting gates and herd management systems, syncing your herd's heat and mating data to keep everything up-to-date, so that you can focus on taking action.

A diagram showing the Halter logo in the center, connected to four external systems: MINDA, DeLaval, MilkTechNZ, and Easy Dairy Automation Systems, representing software or hardware integrations.

Plus, all the data you’ve ever dreamed of

Stay across the performance of your key pasture metrics over time, so you can identify improvements and make tweaks to your strategy as you go.

Paddock performance

Find the highest performing paddocks

Halter automatically calculates how much you’ve harvested from every paddock.
Mobile interface showing a recent grazing event with detailed pasture and herd metrics, including number of cows, area grazed, time spent, and dry matter offered and consumed.

Grazing history

Access your complete grazing history

Go back in time and understand key details for every grazing you’ve planned with Halter.
Halter’s desktop dashboard displays cow behaviour trends over time including grazing, ruminating, moving, and resting minutes per day, alongside feeding data by source and milk production.

Performance feedback

Analyse feeding decisions

Review how grazing decisions impacted your herd’s behaviour & milk production, for the ultimate feedback loop.
A mobile screen showing paddock performance metrics in the Halter app, highlighting total dry matter harvested per hectare for the current and past seasons.

Insights

View progress of key metrics against target

Always know how your farm is performing, relative to the targets you set for key pasture metrics like APC, pre-graze cover, post-graze residual, and leaf stage grazed.

Real dairy farmers, real results

Hear from more dairy farmers

What would an extra tonne of pasture per hectare mean for you?

A farmer stands in the foreground, observing a herd of dairy cows wearing Halter collars as they graze on a green pasture, with rolling hills and a blue sky in the background.